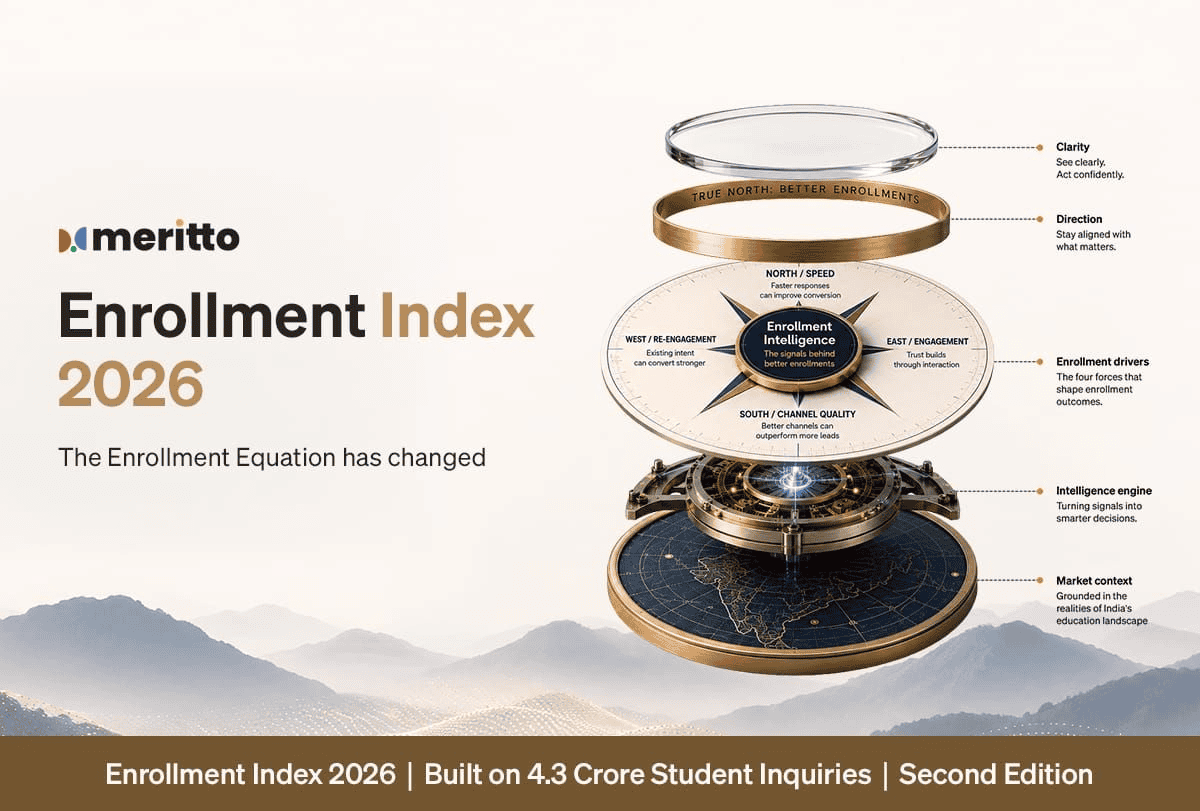
What does it take to enroll a student in 2026? The answer, it turns out, has changed more dramatically in the past year than in the decade before it.
Meritto, India’s largest enterprise vertical SaaS platform for education and the originator of the Enrollment Cloud category, has released the Enrollment Index 2026. The report is built on 4.3 crore aggregated and anonymized student inquiry journeys, nearly double the 2.3 crore analyzed in the 2025 edition.
The central finding is straightforward. Demand for higher education in India remains strong. What has changed is the mechanics of how students discover, evaluate, and commit to institutions. For enrollment leaders, the operative question has shifted from “how do we generate more leads” to “how do we convert the leads we already have.”
Seven findings stand out.
AI-Generated Discovery Is the Highest-Converting Channel in the Funnel
For the first time, the Index measures enrollments that originate from AI-generated discovery platforms such as ChatGPT and Google Gemini, etc. where students ask questions like “which college should I apply to for an MBA in India” and receive an institution-specific answer before ever visiting a website.
The data shows that students who discover institutions through AI platforms convert at 6.11%, compared with a 0.94% average across digital channels, roughly six times higher. These students arrive having already received a curated recommendation, which compresses the evaluation stage of the funnel considerably.
This shift is already visible in organic traffic data. An analysis of nine leading public universities found that several saw organic search traffic decline by more than 35% between August 2024 and April 2026.
The implication for institutions is direct. Generative Engine Optimization, the practice of structuring institutional information so that AI models surface it accurately, is no longer a peripheral consideration. It is becoming a primary discovery channel, and the institutions that build presence in it now will hold a durable advantage as the channel scales.
Re-Engagement Outperforms Acquisition by a Wide Margin
Re-inquired leads, students who contacted an institution previously, did not enroll, and returned via different channels, represent just 14% of total lead volume but account for 40% of all enrollments.
The conversion gap explains why re-inquired leads convert at 3.00%, against 0.74% for first-time inquirers, a 4x difference. A first inquiry typically represents exploration. A second inquiry represents intent.
This has a structural implication for how the funnel is read. The same pool of students produces two very different conversion rates depending on whether they are counted as first-time inquirers (0.74%) or as re-inquirers (3.00%), a 4x difference. Re-engagement activity, including triggered follow-ups, timely reminders, and personalized outreach, sits at the center of that gap.
The channel data adds a further layer. Brandpull contributes the largest share of re-inquiry enrollments at 16.57%, the highest of any channel measured, while Offline contributes 8.31%. The report frames this as a reversal of how these channels are typically understood: Brandpull functions less as a top-of-funnel awareness tool and more as a closing mechanism, and Offline engagement functions less as a funnel endpoint and more as a bridge that brings students back into it.
Response Speed Is a Direct Conversion Multiplier
The Index reconfirms a finding that is simple to state and still widely under-implemented: institutions that respond to inquiries on the same day convert at 2x the rate of those that respond after a week, holding the lead, channel, and program constant.
Engagement intensity compounds this effect. Leads that receive at least one successful outbound call convert at 2.29%, against 0.75% for leads with no call, roughly a 3x difference. And the gap between engaged and unengaged leads overall is significant: 57.39% of leads are classified as engaged, and this group accounts for the majority of conversions across nearly every channel.
For institutions, this points to response infrastructure, automated acknowledgments, counselor routing, and instant messaging, as a direct lever on enrollment outcomes rather than a back-office efficiency measure.
Lead Volume and Conversion Efficiency Are Different Metrics, and Often Move in Opposite Directions
The Index introduces the Channel Efficiency Ratio (CER), which measures each channel’s lead-to-enrollment conversion against the national baseline of 1.06%. A positive CER indicates a channel converts better than the baseline; and a negative CER, worse, regardless of lead volume.
Applied to paid channels, the pattern remains consistent. The channels generating the largest share of leads often deliver weaker conversion efficiency, while lower-volume channels frequently convert more effectively. Across the ten paid channels measured, higher lead volume does not necessarily translate into stronger conversion performance.
The strategic implication is that lead volume and lead quality should be tracked, budgeted, and reported as separate metrics. An institution optimizing solely for lead volume will, by this data, systematically overinvest in the channels least likely to produce enrollments.
Conversion Varies Significantly by Geography, and the Variation Is Where the Strategy Should Live
The national lead-to-enrollment baseline is 1.06%, but this figure obscures meaningful variation underneath it.
By state tier, Tier 3 states convert at 1.84%, compared with 0.99% for Tier 2 and 0.95% for Tier 1. This is a counterintuitive result: institutions might expect students in smaller towns to be harder to convert, but the data suggests the opposite, students reaching an institution’s funnel from Tier 3 markets tend to be further along in their decision and less likely to be evaluating a large set of competing options.
By zone, North and East India both convert at 1.24%, West at 1.08%, South at 0.94%, and Central at 0.61%, a spread of more than 2x between the highest and lowest performing zones.
The takeaway is that broad national campaigns may be a less efficient use of budget than localized, data-driven engagement calibrated to the specific conversion dynamics of each state and zone.
Student Mobility Follows Defined Corridors, Not Random Patterns
The Index maps how students move across India’s regions and states, and the patterns are concentrated rather than diffused.
At the zonal level, the East-to-North corridor accounts for 41.67% of all cross-regional student flow, the largest single migration pattern in the dataset. At the state level, 43.6% of students leaving Bihar choose Uttar Pradesh, and 27.75% of students leaving Haryana move to Punjab, while Punjab (94.6%) and Tamil Nadu (92.5%) retain the large majority of their own students.
For institutions, this means recruitment geography is not a guessing exercise. The corridors are identifiable, and outreach can be targeted to the states and zones from which an institution’s prospective students are most likely to originate.
Every Program Type Converts Through a Different Channel Mix
The Index breaks down channel performance by program category, undergraduate, postgraduate, diploma, certification, and PhD, and finds that each follows a distinct pattern.
Undergraduate enrollments are led by Brandpull (33.45%), reflecting a longer research and evaluation phase. Diploma enrollments are led by Offline engagement (48.90%), reflecting the importance of local outreach and direct counselling. Postgraduate enrollments are led by Publisher Campaigns (29.82%), reflecting active comparison shopping across institutions. Certification enrollments are led by Paid Ads (30.82%), reflecting shorter decision cycles. PhD enrollments are led by Brandpull (43.66%), reflecting the role of institutional reputation and faculty credibility.
A single channel strategy applied uniformly across all five program types will, by definition, be misaligned with at least some of them. The Index frames this as treating acquisition not as one market but as five, each with its own channel logic.
The Bigger Picture
Mr. Naveen Goyal, Founder and CEO of Meritto, summarized the shift this way: the gap between institutions is no longer about who generates the most leads, but about who converts intent more effectively after discovery.
The Index identifies three durable shifts in how enrollment performance is created: referenceability is beginning to outperform visibility, speed now outperforms scale, and re-engagement now outperforms acquisition. None of these shifts require institutions to spend more. They require institutions to direct existing effort toward the parts of the funnel the data shows are underperforming relative to their potential.
Enrollment Index 2026: Key Figures at a Glance
| Finding | The Number |
| AI discovery conversion rate | 6.11% (vs. 0.94% digital average) |
| Re-inquiry share of leads vs. enrollments | 14% of leads generate 40% of enrollments |
| Re-inquiry conversion rate | 3.00% (vs. 0.74% for first-time inquirers) |
| Same-day response advantage | 2x conversion vs. one-week delay |
| National conversion baseline | 1.06% |
| Tier 3 state conversion rate | 1.84% (highest among all tiers) |
| East-to-North migration corridor | 41.67% of cross-regional student flow |
| Dataset size | 4.3 crore student inquiries |
The Meritto Enrollment Index 2026 is available for download at meritto.com/meritto-enrollment-index-2026. The full report includes channel-level benchmarks, program-specific conversion data, regional migration maps, and institution-level AI discoverability scores.
About Meritto
Meritto is the Operating System for Student Enrollments. It is a unified, AI-powered, modular and automated platform purpose built for educational organizations enabling them to attract, engage, and enroll students. With it, educational organizations can automate the entire enquiry to enrollment process.
About Collexo
Collexo is a vertical SaaS-based embedded payments platform which operates as a unified suite for fee collections and payments. It has been built to automate and streamline the entire fee collection process, from fee payments to reconciliation and invoicing. It is integrated with payment gateways as a software provider on top of licensed payment partners. We empower educational organizations to build various workflows, receipts, automations, and student journeys.
About Mio AI:
Mio AI acts as the core layer that powers both student engagement and team performance, with a suite of purpose-built intelligent agents embedded across the platform. With it, your students get faster, smarter engagement, and your teams get an AI-powered co-pilot that makes every hour more productive.
FAQs: Meritto Enrollment Index 2026
The Meritto Enrollment Index 2026 is India’s most comprehensive annual report on student enrollment trends. Built on 4.3 crore aggregated and anonymized student inquiry journeys, it benchmarks what actually drives enrollment decisions across Indian higher education institutions from AI-powered discovery and re-inquiry behavior to regional mobility patterns and response speed. It is published annually by Meritto, a unified, AI-powered, modular, and automated platform purpose-built for educational organisations, enabling them to attract, engage, and enrol students and automate the entire enquiry-to-enrollment process.
The 2026 edition is based on 4.3 crore student inquiry journeys significantly larger than the 2025 edition. The dataset spans multiple program types, geographies, and institution categories across India, making it one of the largest first-party enrollment intelligence datasets published in the country.
According to the Meritto Enrollment Index 2026, students who discover institutions through AI platforms such as ChatGPT, Google Gemini, or Perplexity are 6 times more likely to enroll compared to students arriving via traditional digital channels. This finding marks the first time AI-generated discovery has been formally measured as an enrollment intent signal in India.
Channel Intelligence is one of the five core modules in the Enrollment Index 2026. It analyzes which student acquisition channels: organic search, paid digital, AI platforms, offline referrals, etc. drive inquiry volume versus which ones actually convert into enrollments. The module helps institutions reallocate their enrollment marketing budget toward channels with the highest conversion signal rather than the highest volume.
Program DNA refers to the enrollment index’s analysis of how different academic programs differ in their student decision journeys. Engineering, MBA, and medical programs, for instance, show distinct patterns in inquiry-to-enrollment timelines, re-inquiry rates, and the role of financial incentives. Program DNA helps admission teams tailor their engagement strategies by program rather than using a one-size-fits-all approach.
The report is primarily designed for enrollment leaders, admission directors, marketing heads, and institutional management at higher education institutions, EdTech companies, coaching institutes, and K-12 schools in India. It is also relevant for education investors, policy researchers, and EdTech product teams looking for data-backed benchmarks on student behavior and enrollment conversion.
Yes, the full report is available as a free download. Readers can access the complete findings, benchmarks, and data-led strategies by filling out a short form on the Enrollment Index 2026 page at meritto.com.
Institutions can use the Enrollment Index 2026 as an annual benchmark to audit their own enrollment performance against industry data. Specifically, the Channel Intelligence module helps institutions identify over-invested acquisition channels; the Speed & Engagement module provides concrete response-time benchmarks; the Re-Engagement Advantage highlights where existing lead databases can be reactivated; and the Migration Map reveals geographic recruitment opportunities. Together, the five modules provide a diagnostic for shifting from a “how do we generate more leads” question to a “how do we convert better” strategy.
Recommended Reads
- Connected Intelligence: The Infrastructure Behind Institutional Agility

- More Data, But Less Insight? Inside the Intelligence Era of Education
- How universities can turn AI into real institutional impact
- Which CRMs Can Show Cost per Lead and Cost per Enrollment by Channel?
- How to Track Digital Marketing Agency Performance for Student Recruitment
- Admission Counselor Productivity: Tools to Track Performance Effectively